WordPress Performance Triage: What to Measure and Fix First
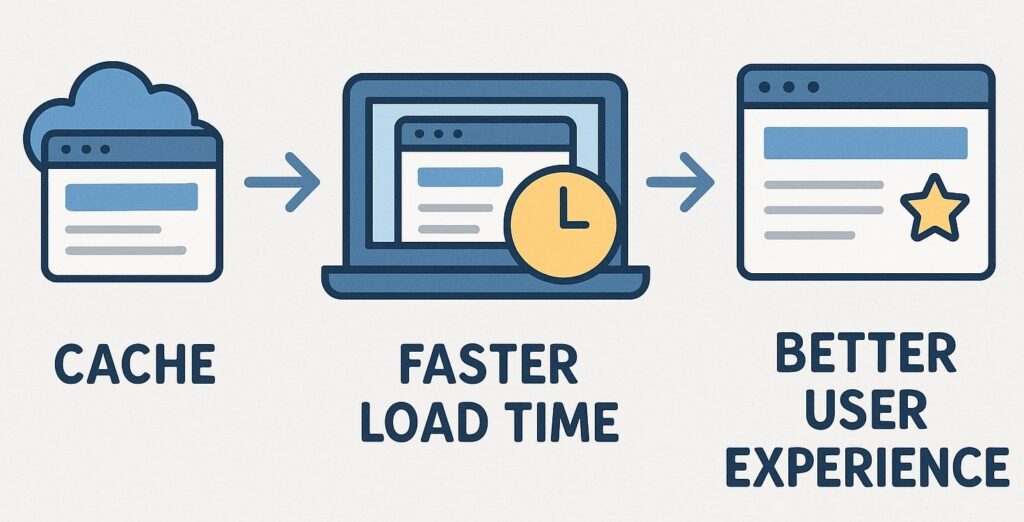
WordPress performance work becomes expensive when the team starts with a plugin instead of a diagnosis. A cache can hide some server work, image compression can reduce transfer size, and script controls can reduce JavaScript, but none of those changes explains which constraint is affecting users on the pages that matter.
A reliable process starts with representative URLs, repeatable test conditions, and a rollback plan. It then works from the earliest bottleneck in the request toward later rendering and interaction costs.
1. Separate field data from lab data
Field data describes visits from real users over time. Lab data loads a page under controlled simulated conditions. Both are useful, but they answer different questions.
- Field data helps determine whether real visitors are experiencing slow loading, delayed interaction, or layout movement across a recent reporting window.
- Lab data helps reproduce a page, inspect its request waterfall and main-thread work, and compare a change before release.
The current Core Web Vitals are Largest Contentful Paint (LCP), Interaction to Next Paint (INP), and Cumulative Layout Shift (CLS). Google documents good thresholds of LCP at 2.5 seconds or less, INP at 200 milliseconds or less, and CLS at 0.1 or less, evaluated at the 75th percentile of visits. See the official Web Vitals reference for the measurement model and current lifecycle.
Lighthouse cannot measure real INP because a simulated page load has no real sequence of user interactions. Total Blocking Time is a lab diagnostic, not an INP replacement. One green Lighthouse run is therefore not proof that every user and template is fast.
2. Choose representative pages
Do not optimize only the home page. Build a small test set around the site's actual templates and business risk:
- home or primary landing page;
- a high-traffic article or archive;
- a service or lead-generation page;
- a product, cart, or checkout flow when ecommerce is present;
- an authenticated page when the client area matters.
Record the test URL, device profile, location, cache state, consent state, and whether the visitor is signed in. Comparing a warm desktop result with a cold mobile result produces a persuasive screenshot but no useful engineering conclusion.
3. Fix slow initial response before polishing the frontend
If the first HTML response is consistently slow, investigate the platform before chasing icon files or small CSS rules. Common causes include underpowered hosting, uncached dynamic requests, slow database queries, external API calls during rendering, excessive autoloaded options, and plugin hooks that run on every request.
Check:
- server and edge response timing with and without a warm cache;
- PHP and database resource limits;
- full-page cache exclusions and cookie behavior;
- slow queries and remote calls in an application performance monitor;
- scheduled tasks or background jobs that compete with user requests.
The WordPress performance optimization handbook treats hosting, software, caching, compression, content delivery, and database tuning as related layers. That is a better model than expecting one plugin to solve all six.
4. Make the LCP resource easy to discover and appropriately sized
On many marketing pages, the largest visible element is a hero image or heading block. For an image LCP:
- serve dimensions close to the rendered size;
- use a modern format where it produces a meaningful reduction;
- provide width and height or a stable aspect ratio;
- avoid lazy-loading the above-the-fold LCP image;
- make the resource discoverable in the initial HTML instead of injecting it late with JavaScript;
- review CDN resizing and cache headers.
Do not preload every hero candidate. Responsive designs can select different resources, and unnecessary preloads consume bandwidth that the browser could use for CSS, fonts, or the actual image.
5. Reduce JavaScript by ownership, not by guesswork
A WordPress page often accumulates scripts from analytics, advertising, consent, chat, page builders, sliders, forms, and plugins. List each script, its owner, its business purpose, and the pages where it is required.
Then ask:
- Can it load only on templates that use the feature?
- Can a nonessential third party wait for consent, interaction, or idle time?
- Is the same library loaded by more than one plugin?
- Does removing the script break lead attribution, checkout, accessibility, or legal controls?
Test interactions after every meaningful script change. A lower lab score is preferable to a broken purchase, form, menu, or consent workflow.
6. Prevent layout shifts at the source
Reserve space for images, embeds, ads, notices, and asynchronous widgets. Use stable font fallbacks and avoid inserting banners above content after the page has begun rendering. Cookie controls and ad slots should be tested after interaction, because post-load movement can be absent from a simple lab run but visible in field CLS.
7. Treat database cleanup as maintenance, not theater
Revisions, expired transients, abandoned plugin tables, and oversized autoloaded options can matter, but deleting rows does not automatically improve a slow frontend. Measure query behavior and database size first. Take a verified backup, test cleanup on staging, and avoid deleting tables merely because their names look old.
8. Validate the business after the speed work
A performance release is not complete when the score changes. Recheck:
- forms and confirmation email;
- analytics and campaign attribution;
- consent behavior;
- search, menus, filters, sliders, and video;
- account, cart, and checkout flows;
- cache behavior for signed-in and signed-out visitors;
- the same representative URLs used for the baseline.
Document what changed, the test conditions, the remaining constraints, and how to roll back. Performance is an operating discipline: control payload growth, review third parties, monitor field data, and test the templates that generate revenue rather than optimizing a single screenshot.