WordPress admin slow? Trace a slow dashboard, editor or save
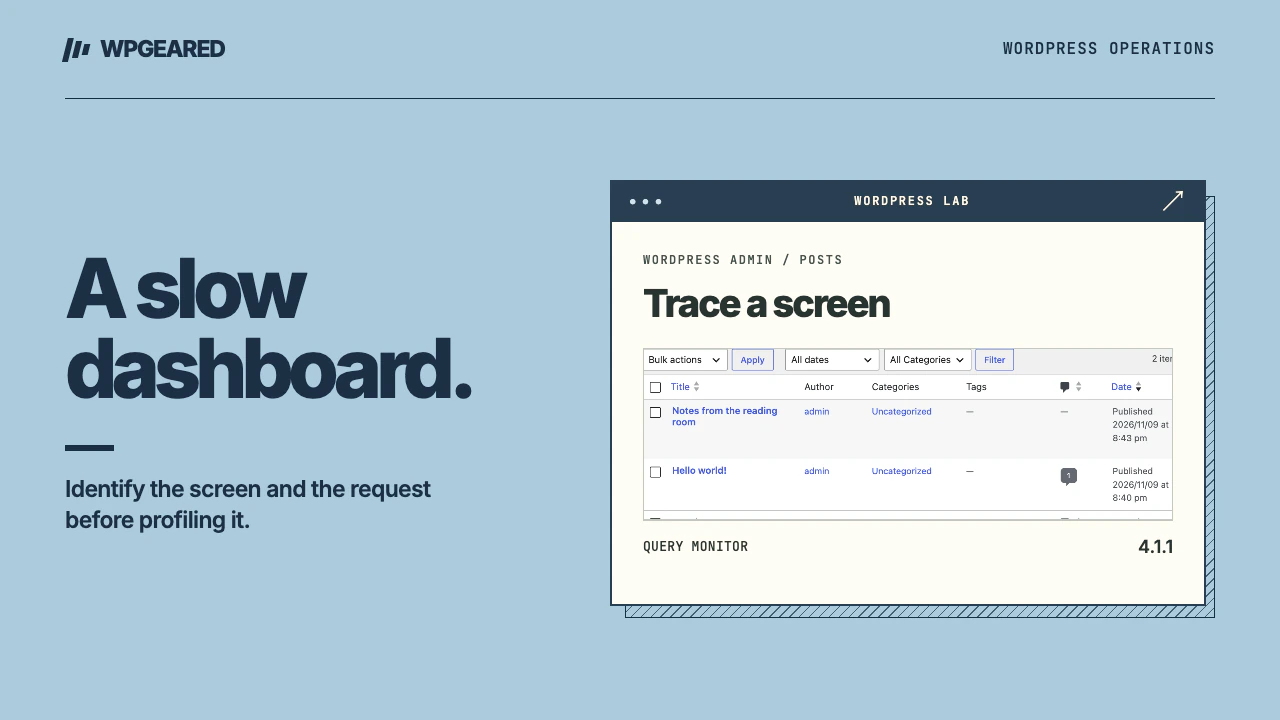
A slow WordPress admin needs a trace of one slow action. Time the dashboard, a post list and a save separately, then determine whether the browser is waiting on PHP, the database, an external service or JavaScript. A fast public homepage can coexist with a slow backend because a page cache often serves the former without running the same application work.
WordPress admin slow on every screen or only one?
Open three admin URLs in the same browser and account: Dashboard, Posts and the edit screen for a small post. Record the start time and where the delay ends. Then repeat the specific task an editor reported. A post list with custom columns may run expensive lookups for every row. A slow dashboard widget might contact an external API. A save can be held up by an integration that never runs during an ordinary page view.
Use the browser Network panel. For a slow document, distinguish waiting for the response from downloading it. For a slow action after the page appears, inspect Fetch/XHR requests and long-running browser tasks. Note the request path, status code and duration. Don't paste an authenticated request or a full HAR file into a public support forum. It can include session information.
Use Query Monitor to find a specific component
Activate Query Monitor on a staging copy, reproduce the slow screen and inspect its database, HTTP API and PHP panels. Look for queries that consume time, repeated calls from the same component, and outbound requests that wait on a remote host. A list of many fast queries can cost less than one slow external HTTP request. Record the caller, affected object and time together.
For a slow Posts list, reduce the number of posts shown in Screen Options and try the same view again. If time rises sharply with the row count, look at custom column renderers and per-post queries. If one outbound licensing or inventory request consumes most of the wait, check its timeout, scheduling and cache behavior. Avoid deleting the plugin or its data merely because its name appears many times in the trace.
Query Monitor observes the current application request. It cannot see all time spent waiting for a free PHP worker before WordPress runs. It also adds instrumentation of its own. Compare with host-side logs when the browser reports a much longer wait than the PHP panels explain. Remove temporary diagnostic tools after capturing the evidence.
Heartbeat and admin-ajax.php
WordPress's Heartbeat API lets the browser and server exchange periodic updates. Features such as post locking and autosave coordination depend on this background communication. Seeing repeated requests to admin-ajax.php is expected. Open the request payload and identify the action. Other plugins use the same endpoint for unrelated work.
Close extra admin tabs, keep one editor open and compare the frequency and duration of requests. If the interval stays steady but a callback takes seconds to complete, reducing the polling frequency may hide a slow callback without fixing it. On staging, isolate the plugin responding to Heartbeat or adding heavy work to every admin request. After any change, use two test accounts to verify edit locking and draft recovery. Globally disabling Heartbeat as a first step risks losing protections that matter during collaborative editing.
Is a persistent object cache useful?
A persistent object cache can reuse data between PHP requests. It differs from a full-page cache, which stores a rendered response. Enabling public-page caching for authenticated dashboard responses can expose private information and interfere with nonces. Leave authenticated response handling to the WordPress and hosting configuration designed for it.
Look for repeated reads of the same expensive data across separate requests before enabling or changing a cache backend. If a persistent cache already exists, check its connection health, capacity and evictions with the host. A network hop to an unhealthy cache can add latency. Avoid routinely flushing the entire cache on a busy site. That can force many requests to rebuild expensive data together. Document how to return to the previous setting before testing a change.
Check PHP, scheduled work and hosting limits
In Tools → Site Health → Info, record the web server's PHP version, memory limit and database details. The PHP version reported by a command-line shell can differ from the version serving the web request. Test a supported version on staging with your active plugins and theme. A version upgrade alone cannot repair inefficient queries or a remote endpoint timing out.
Correlate the exact slow request with PHP slow logs, worker saturation, database locks and storage latency. Check whether a backup, bulk import or scheduled task coincides with the slowdown. If the issue occurs at the same time daily, collect a trace during the bad window and another outside it. Ask the host for the limiting resource before purchasing a larger plan. If an import consumes all workers, scheduling or batching it may resolve the bottleneck more directly.
Isolate the smallest fix and test the workflow
Create a staging copy with similar post volume and active settings. A blank demo store is a weak reproduction of an admin list containing thousands of records. Disable the suspected extension on the copy, repeat the same account action and then restore it to confirm the result. If a theme switch changes backend performance, investigate code the theme runs on admin requests. A default theme on staging is a diagnostic tool, not a production design change.
After fixing the slow path, try a normal edit, autosave, manual save, media selection and any workflow affected by the change. Keep the before-and-after trace with cache state, plugin versions and timestamps. Use the Elementor editor guide if only that editor is affected, or the general speed guide for a public rendering issue. The WordPress speed service covers cases where the bottleneck crosses PHP, the database and hosting.